🏫 I ❤️ maps. This got started in 2013, as there were no (and probably still there aren’t) interactive detailed maps of all the districts in Costa Rica. It was not possible to, let’s say, generate a data-driven map on-the-fly. jquery was all the rage thenm, and I decided to create a .svg map, and programatically allow to use it. It is available as open source, under Apache License.
tl;dr ? Link to heading
.shp >> .kml >> .svg >> .html+.js :)
The map is able to:
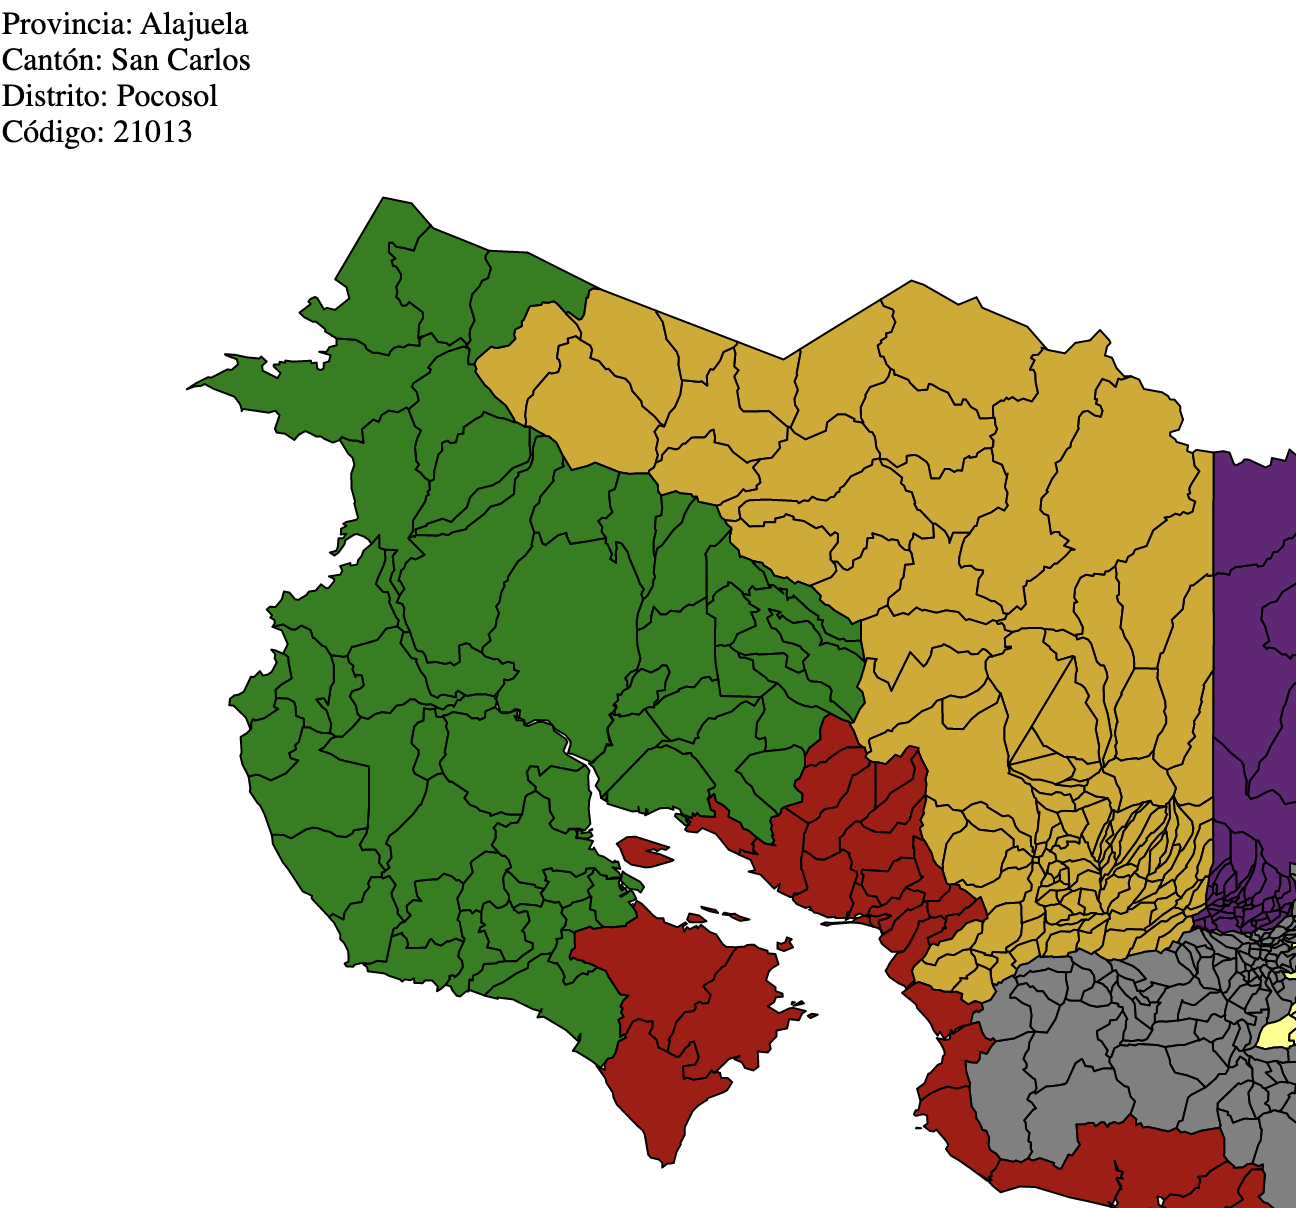
- Display every district
- choose all districts in a provice or canton
- customize colors and their use in animation
- expose per-distrct data (population, area, etc)
Note: The original story/post can be found in my github repo, and the original repo with the its demo is in a the demo website (Spanish).